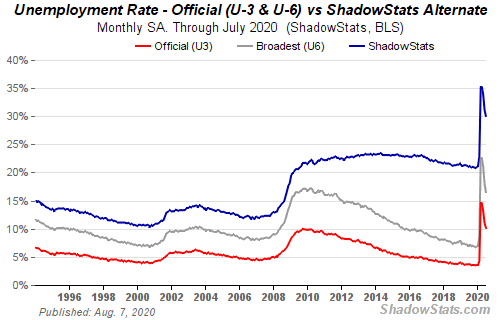
The 8.4% number is considered the "official" unemployment rate by Washington and the major media, it's the red line is this chart above. The reason is because it's the lowest rate, and it looks the best in TV and web reports. That 8.4% number is the U-3 number, for August 2020, from the U.S. Bureau of Labor Statistics (BLS). The problem with the U-3 unemployment number is that is doesn't include a lot of people who are not working, in fact doesn't include most of the people who are not working. In any "normal" time, unemployment at 8.4% would be catastrophic, economists want to see real unemployment at about 3% to 4%. So this U-3 more than number is double that. That's bad, horrible, in fact, in "normal times." But in a year when close to 50 million lost their jobs in a few months, most of them"temporarily" lost, 8.4% is LESS BAD, than the 15% a couple of months ago. The problem is, the U-3 number doesn't count about 3/4 of the U.S. adults who are actually not working.
There's another unemployment number, the U-6 number, and it's just as official as the U-3 number, and it's also put out by the BLS, that's the U-6 unemployment rate. The U-6 number dropped to 14.24% for August 2020, and that's the gray line above. What's the difference? The U-3 number basically counts people with traditional jobs who applied for unemployment insurance, that's all. The U-6 number takes that, and adds in people who are forced to work part time, because they can't find full time work, and people who have been discouraged from looking for work in immediate future, they don't think they can find any job soon. So this U-6 number, makes more sense, it's every bit as official as the U-3 number, and it tells us that over 14% of working people in the U.S. aren't working right now.
So what's that scary blue line above, that figures U.S. unemployment at 27 to 28%? That's the number by this website, shadowstats.com, and it takes the U-6 number, and adds in the "long term discouraged" workers, those are American adults of working age, who simply have completely given up looking for work altogether. They either don't think they can ever find a job again, or they have some way to survive without working.
The total American "workforce," is just under164 million people, out of the total 328 million (+/-) Americans. The shadow stats number is the closest to actually showing us how many of the people in the "workforce" are not working right now. So if we figure 27% of the "workforce" isn't working right now, that's 44.5 million American adults NOT working, out of 164 million. If you go through all the actual Bureau of Labor Statistics numbers, you'll find that well over 44.5 million American adults are NOT working right now. Here, dig through the numbers yourself. Here's the official stats for August 2020. If you look at the "participation rate" on this chart for August 2020,it says 61.7%. That means 38.3% of the "American workforce" isn't working right now. Some of those are housewives who take care of the kids, or dads doing that job, and some others who don't work a job or business. So the shadowstats number, roughly 27%, is the closest to a "people who should be able to find work, but can't" number, which is what the unemployment number is supposed to be.
This number doesn't include gig workers, and microbusinesses (1 person business), and small businesses that have lost a lot of their income, but are technically working. So even the 27% number doesn't really give us a good look at how bad of a hit the economic crash (which started with the Repo market in Sept. 2019) AND the Covid-19 shutdown, have hit real world working (and potentially working) Americans.
There's a large group, 7 million + men, and a growing number of women, American adults, who don't even try to find work. This group seems to be living largely on YOUR tax dollars, permanently, getting government checks, from Social Security Disability and other sources. The only person who has looked into this growing group is Nicolas Eberstadt, in his book, Men Without Work. This is a big part of the long term unemployed, and pretty much no one is studying this major American issue right now. And we really need to. Here's a short news clip on his work (February 2017), and here's a full speech by Nicolas Eberstadt, explaining this issue in detail, from 2017.